
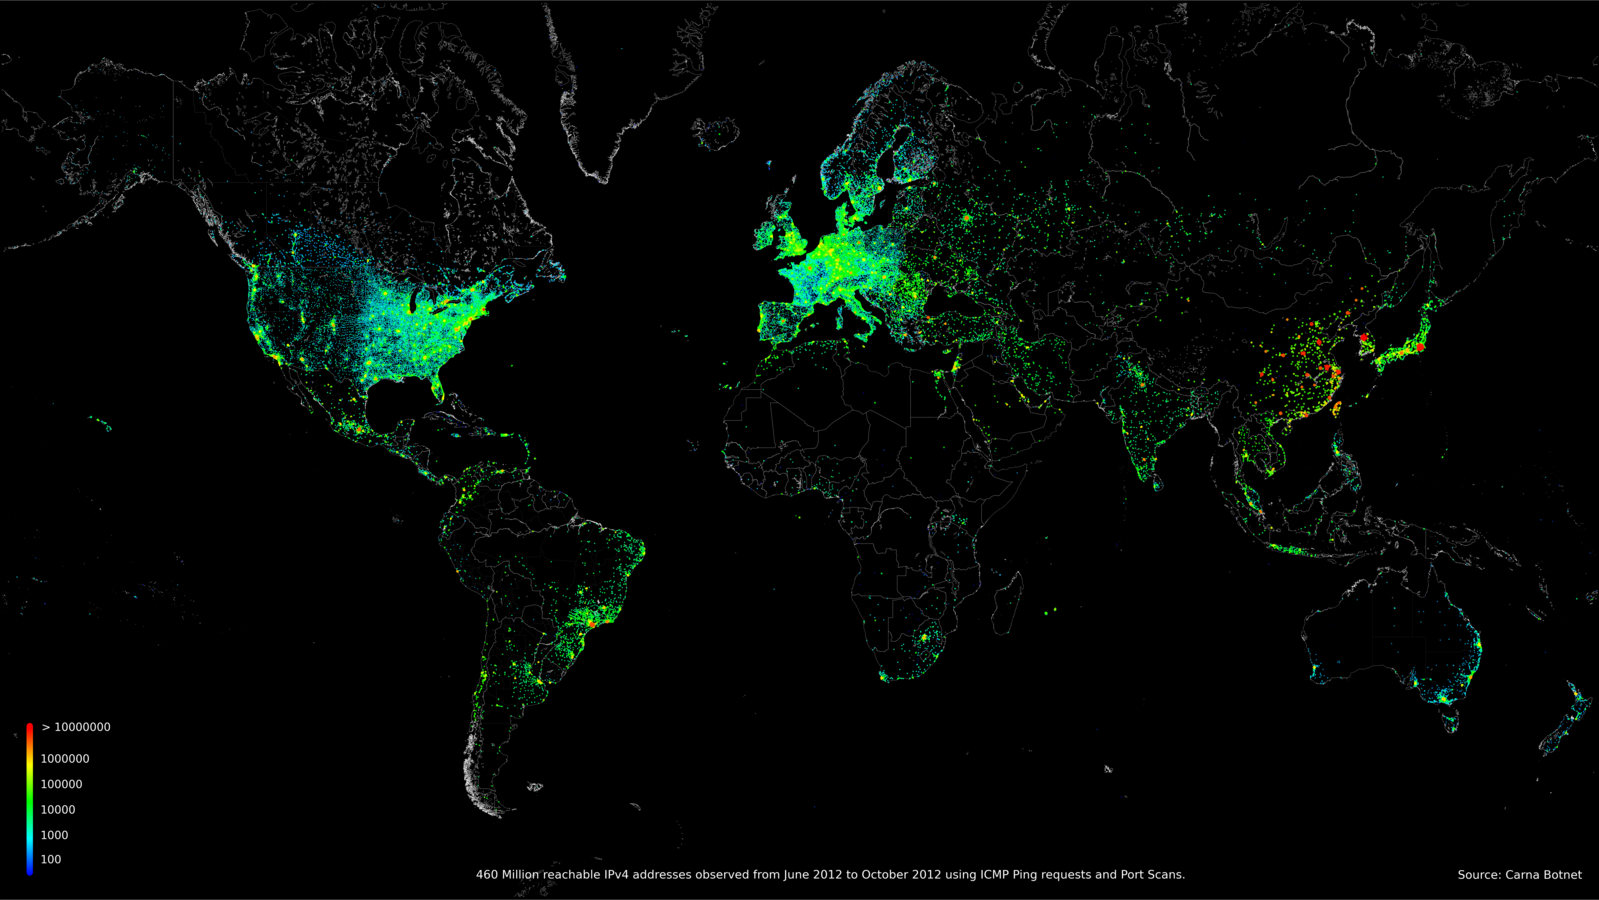
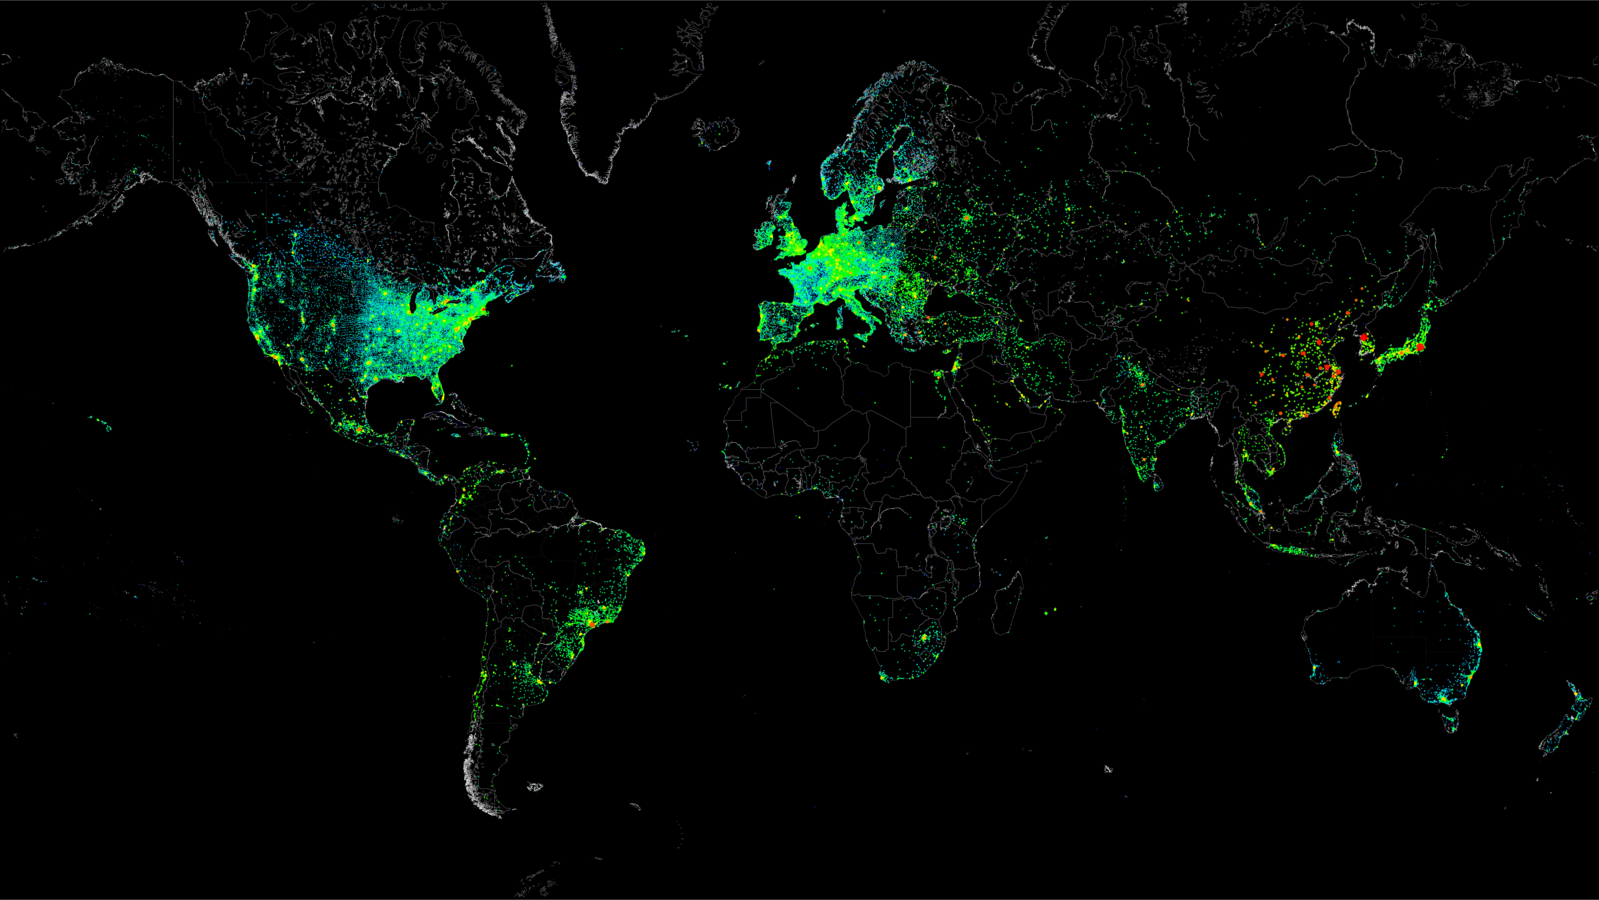
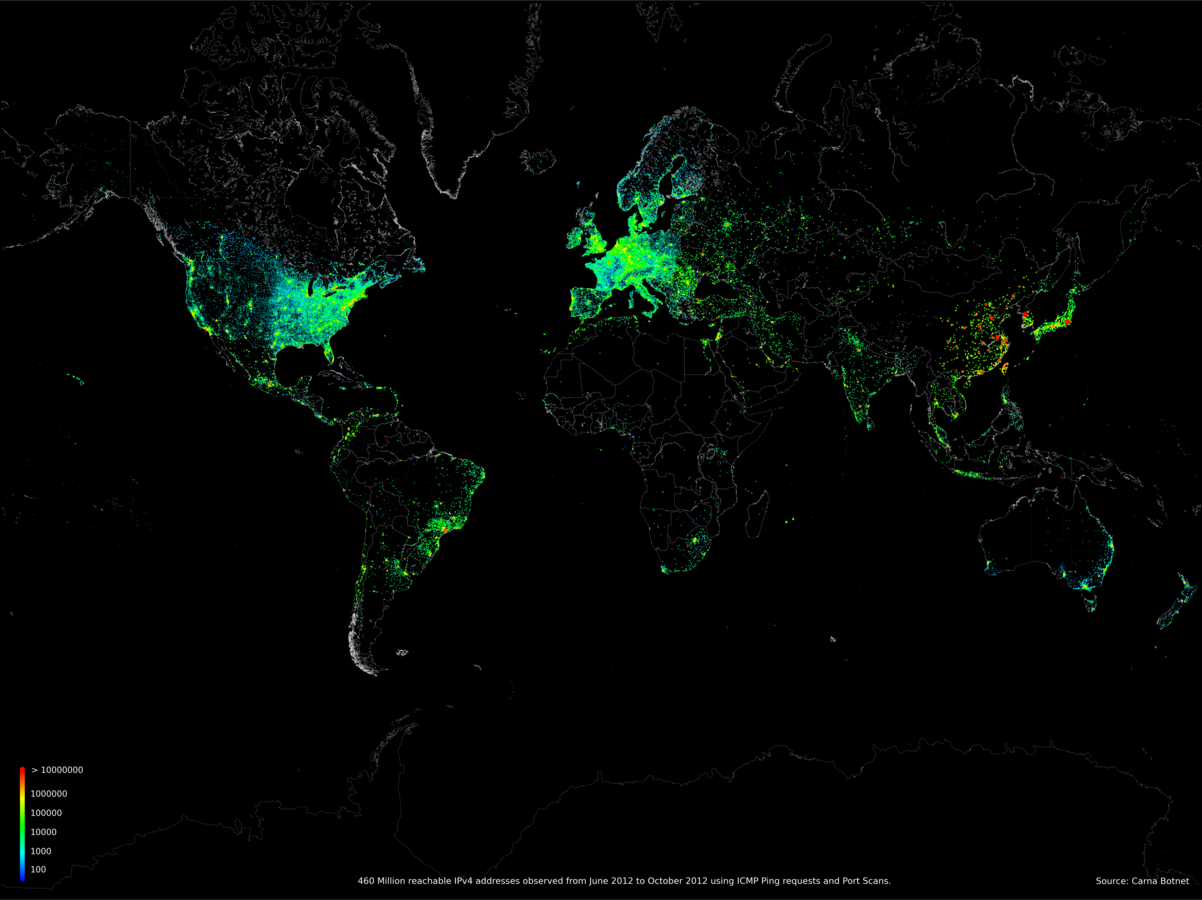
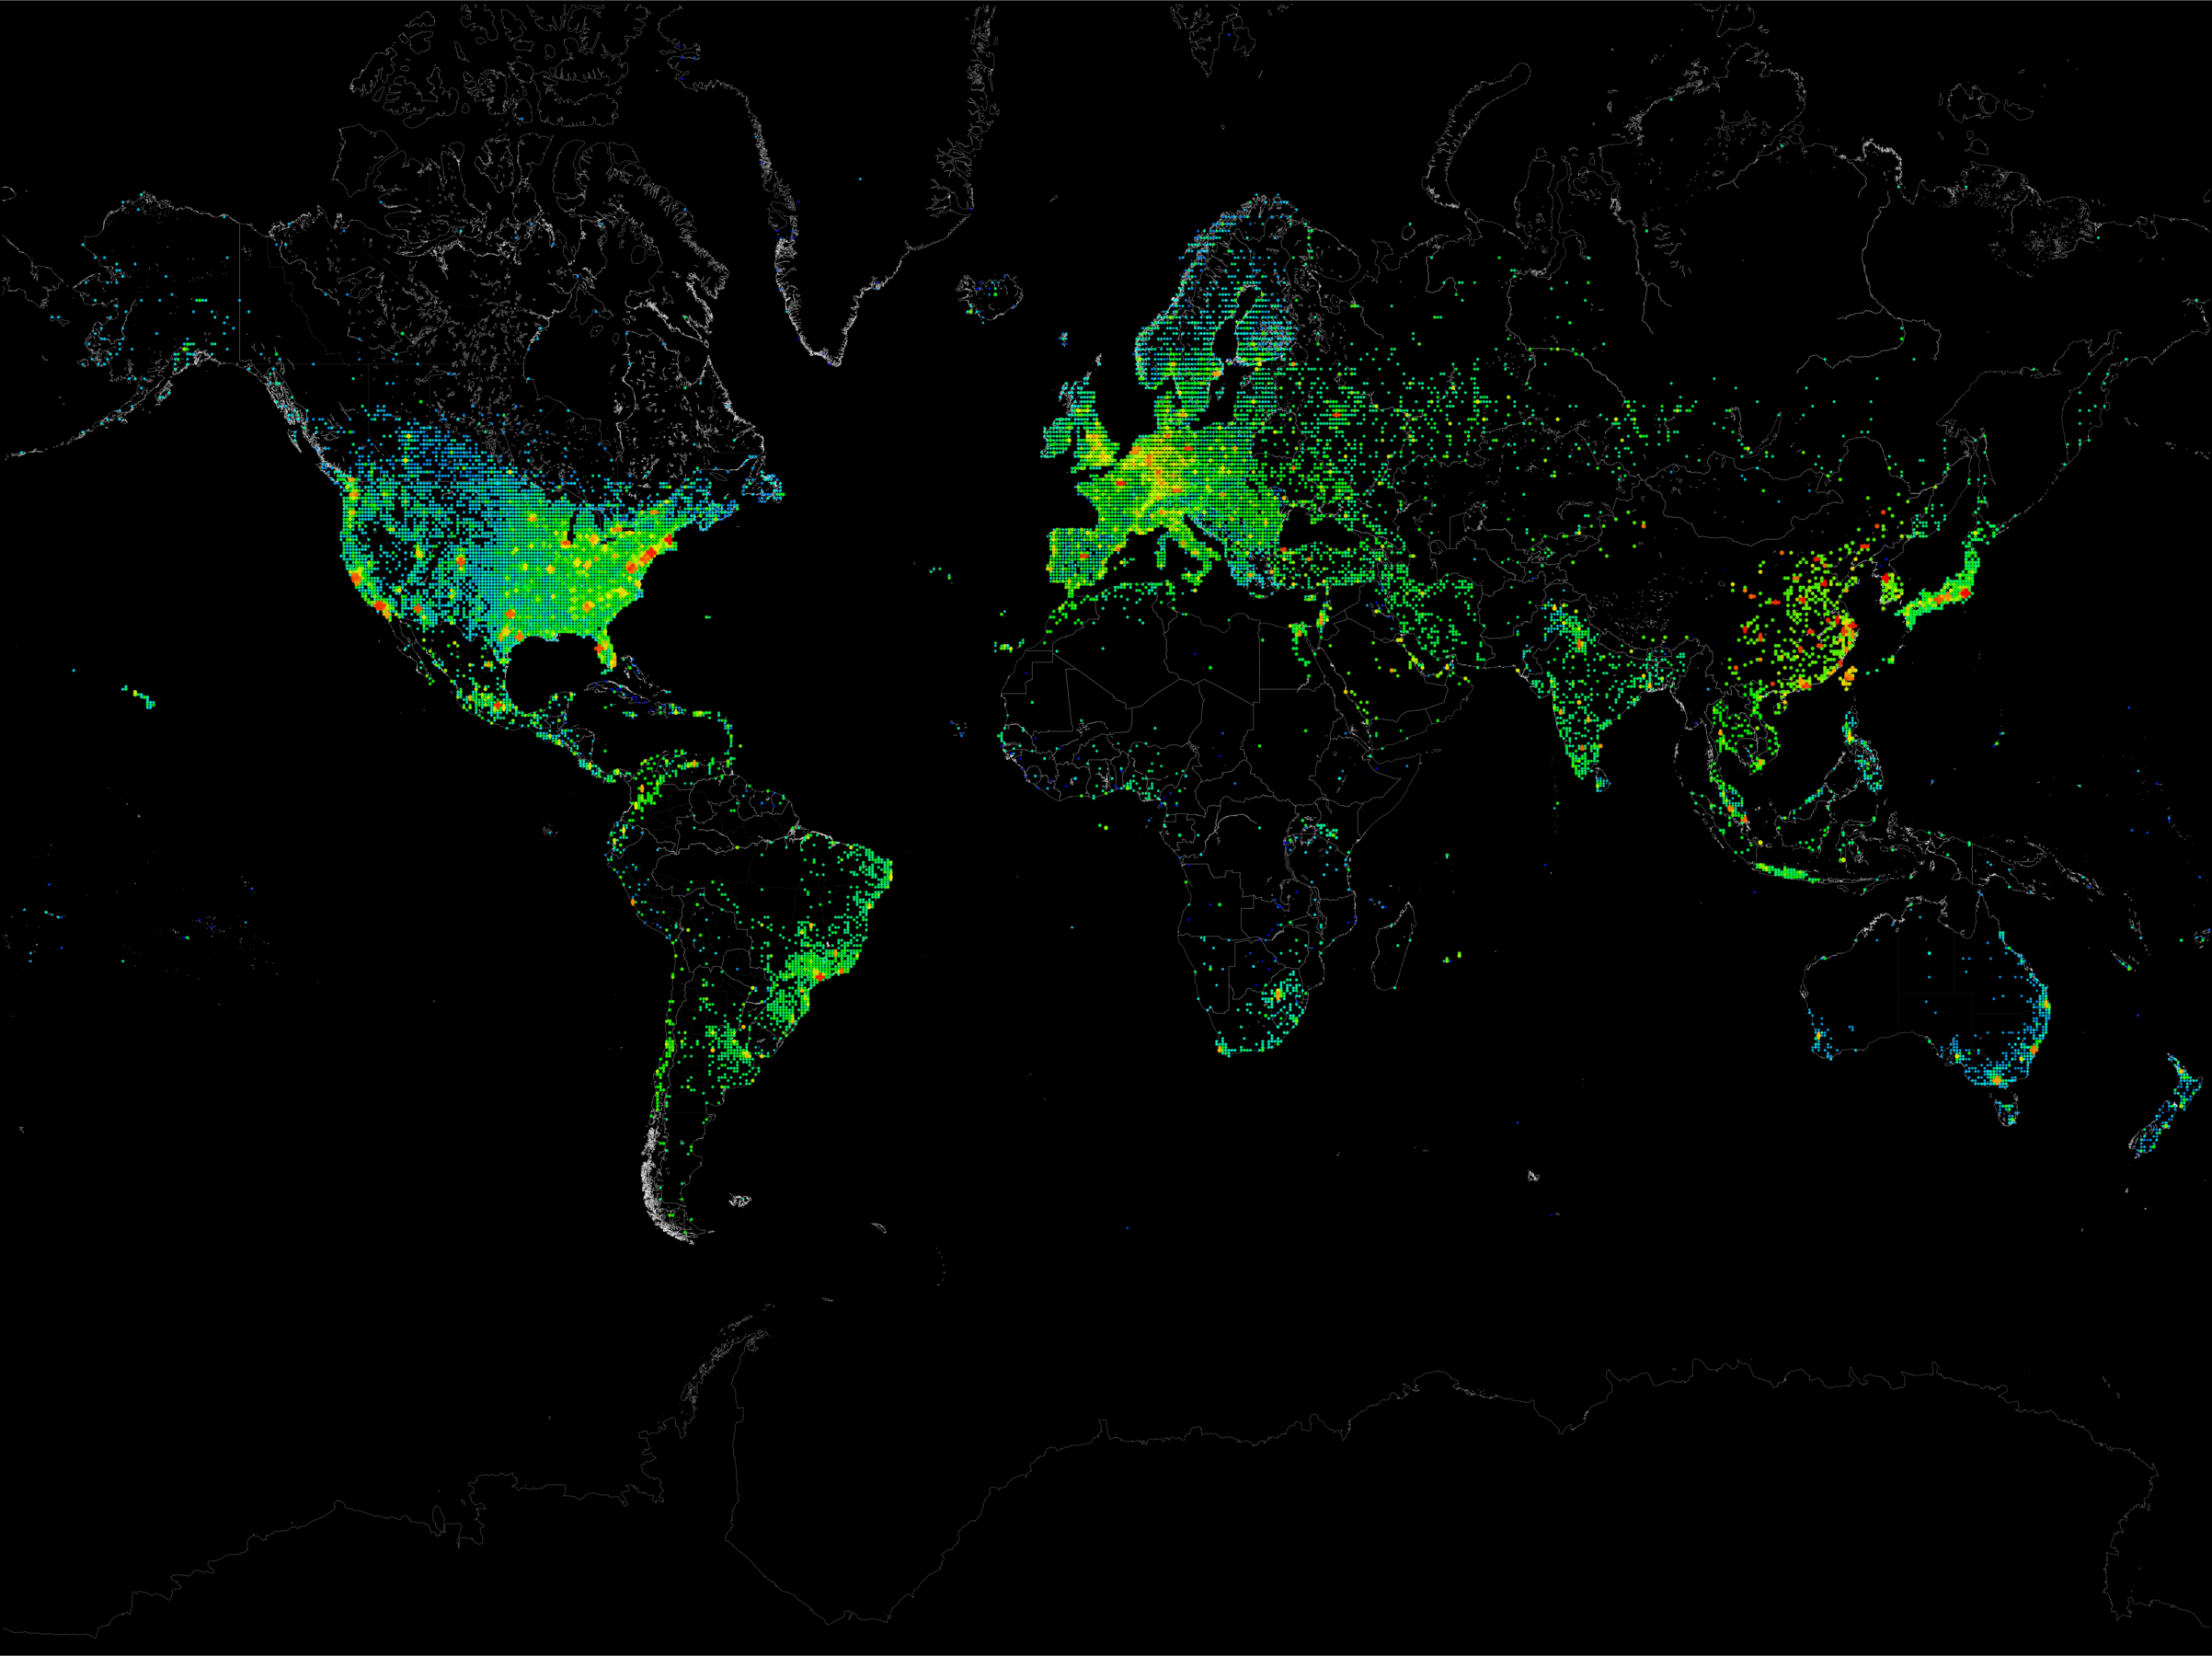
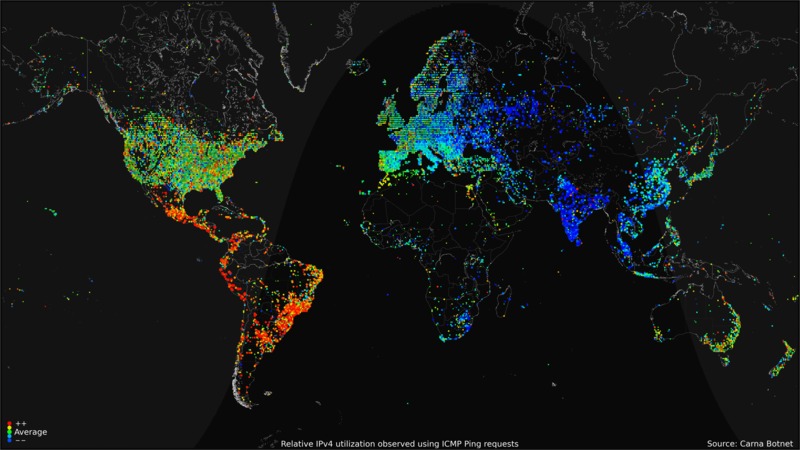
World map showing the 460 Million IP addresses that responded to ICMP ping requests or port scans from June and October 2012. Theses maps where generated in a high and a low geolocation resolution version, either with or without a legend and in aspect ratios of 16/9 and 4/3.
High geolocation resolution:
16/9 1600x900 3200x1800
16/9 no legend 1600x900 3200x1800
4/3 1600x900 3200x1800
4/3 no legend 1600x900 3200x1800
Low geolocation resolution:
16/9 1600x900 3200x1800
16/9 no legend 1600x900 3200x1800
4/3 1600x900 3200x1800
4/3 no legend 1600x900 3200x1800
High geolocation resolution:
16/9 1600x900 3200x1800
16/9 no legend 1600x900 3200x1800
4/3 1600x900 3200x1800
4/3 no legend 1600x900 3200x1800
Low geolocation resolution:
16/9 1600x900 3200x1800
16/9 no legend 1600x900 3200x1800
4/3 1600x900 3200x1800
4/3 no legend 1600x900 3200x1800

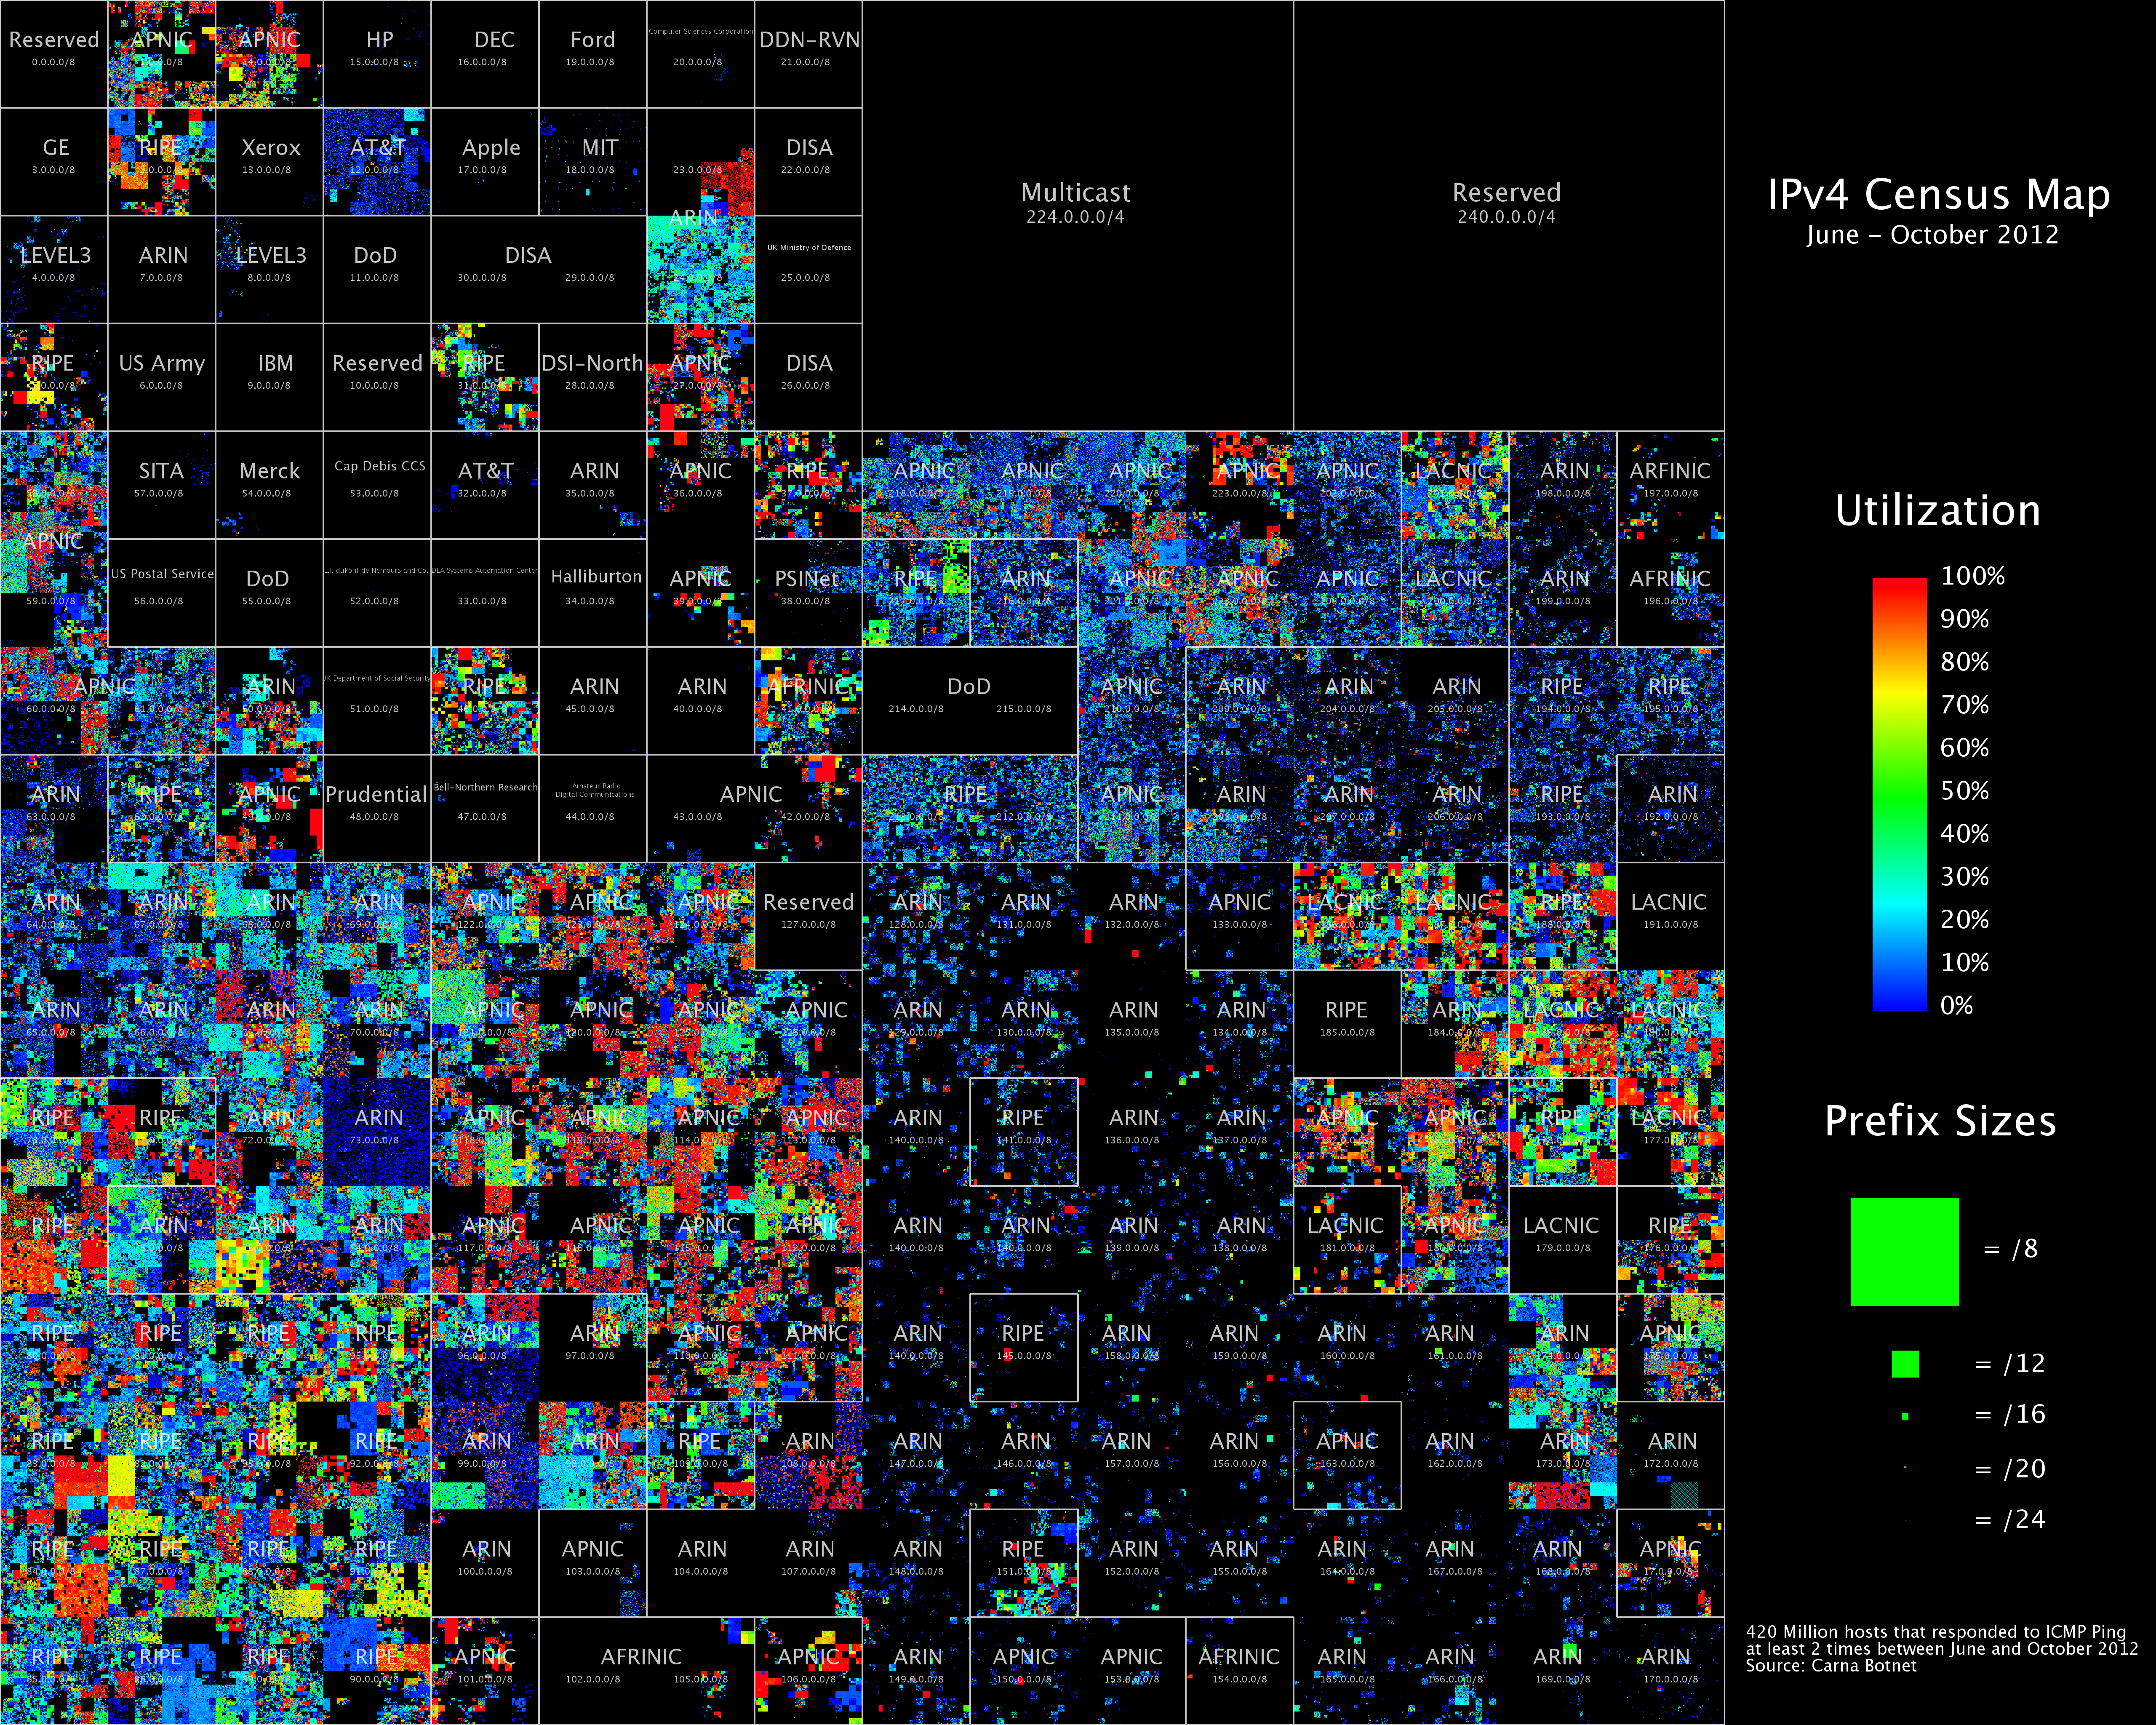
Hilbert map of the 420 Million IP addresses that responded to ICMP ping requests at least two times between June and October 2012. The IP space is mapped to a 2-dimensional Hilbert Curve as inspired by xkcd. For a zoomable, clickable version of this image as well as other data projected in a Hilbert curve take a look the Hilbert Browser.
5120x4096 8 MB full size image
Click here to start animation
World map of 24 hour relative average utilization of IPv4 addresses observed using ICMP ping requests.
9 MB full resolution GIF
2.4 MB low resolution GIF
Single frames, 17 MB tar file
Click here to start animation
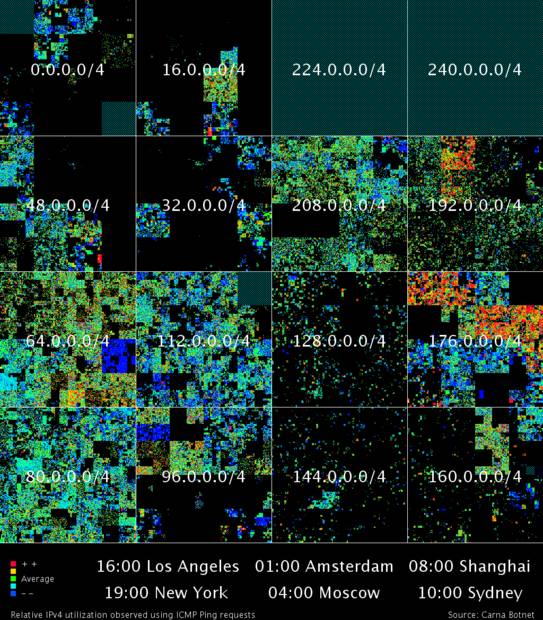
Hilbert map of 24 hour relative average utilization of IPv4 addresses observed using ICMP ping requests.
14 MB full resolution GIF
2.5 MB low resolution GIF
Single frames, 14 MB tar file

420 Thousand Carna Botnet clients active from March to December 2012.
Clientmap 1600x900
Clientmap 3200x1800